Comparative Analysis of the Autonomous Vehicle Industry in the USA and China
Download PDFIndex
- The Automotive Market in the USA and China
- Innovation Management for Autonomous Vehicles in the U.S. and China
- Policies for the Autonomous Vehicles Industry in the U.S. and China
1. The Automotive Market in the USA and China
1.1 Market Size and Growth
The automotive market in the USA and China has an immense significance on the worldwide stage. The USA, with its legacy of pioneering automotive giants and advanced technological capabilities, has long been a leader in vehicle production and innovation. Meanwhile, China has rapidly emerged as the world's largest automotive market, driven by strong domestic demand and significant investments in electric vehicle technologies (also called EV).
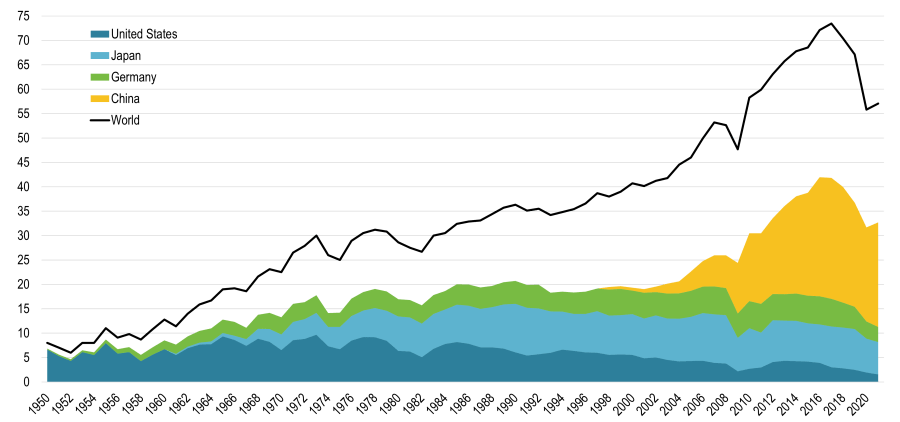
The following figure from the International Organization of Motor Vehicle Manufacturers (figure 1.A) represents Automobile Production across countries including China and the U.S. from 1950 to 2022. It highlights the important shifts in the automotive market over time, particularly between the United States and China. In 1950, the U.S. dominated global car production, holding over 80% of the market. However, by 2021, this share had drastically decreased to only 2.7%, indicating a loss of competitiveness in the U.S. car manufacturing system. Although the U.S. remains the world's largest car market, it is now saturated, with a focus on replacement sales and intense competition between manufacturers. Conversely, China experienced a very rapid growth in car production, reaching 37.5% of global production in 2021.
A. Vehicle registrations
Vehicle registrations are steadily increasing in both China and the USA. However, China maintains a larger automotive market, with total vehicle registrations reaching 311 million, compared to 283 million in the USA [1]. Nevertheless, vehicle registrations include all vehicles currently registered and in use, taking into account both new and older vehicles. This metric gives insights on the general car consumer behavior but not precisely regarding new cars being purchased.
B. Vehicle sales
Hence, studying new vehicles sold in each country separately is also a relevant key to understand the automotive market in a country. According to a report of ACEA "Economic and Market Report: Global and EU auto industry, Full year 2023" [2], China registered 22,320,061 new cars in 2023 and 21,354,717 in 2022 whereas the USA registered only 12,327,829 new cars in 2023 and 10,773,065 in 2022.
C. Vehicle production
Car production in each country is also interesting to be compared since a new car registered in USA can have been produced in China for instance. The same report by ACEA (using S&P GLOBAL MOBILITY sources) [2] demonstrates that in 2022, China was the most important car producer with 23,237,924 units produced when only 7,033,378 units have been produced in the same year in USA. This point reflects China's domination in the automotive industry.
D. Employment contribution and GDP contribution
Overall, the automobile industry has historically contributed to 3 to 3.5 per cent of the overall Gross Domestic Product in the United States and directly employed over 1.7 million people [3] whereas this industry contributes to 10 per cent of China's GDP according to the report "China Automotive Industry Trends to Watch 2023" from EqualOcean Intelligence [4] which demonstrates clearly the considerably higher importance of this sector in China. This trend can be explained by the recent sudden growth of the Electronic Vehicles industry in China that also led to a massive automotive-related employment growth (it indeed reaching over 4 million people in 2023) [5].
1.2 Industry Players and Market Dynamics
A. Key automotive manufacturers
China and the US have historical differences in their relation with the automotive industry. The USA is the birthplace of the modern automotive industry led by Henry Ford's introduction of mass production with the Model T in 1908 and recently challenged by Tesla, whereas China's automotive industry witnessed a later but faster growth thanks to companies such as BYD and Geely focusing on Electric Vehicles.
B. Market concentration and competition
Comparing Market concentration and competitiveness in both countries is a key to understand market dynamics differences. The following quantitative comparison (figure 1.B) of the automotive market in the two regions is relying on the data provided by the website "goodcarbadcar.net" [7].
| USA | China | |
|---|---|---|
| C4 | 0.444 | 0.468 |
| C5 | 0.528 | 0.543 |
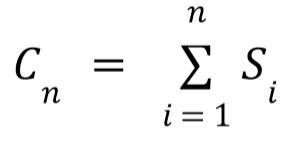
| C6 | 0.585 | 0.616 |
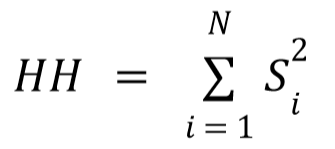
| HH | 0.065 | 0.086 |
Figure 1.B: Concentration ratio and Herfindahl–Hirschman index in USA and China
The table shows that China's automotive market is more concentrated than the USA's, as reflected by higher concentration ratios (C4, C5, C6) and a higher Herfindahl–Hirschman Index (0.086 vs. 0.065). This indicates that a few firms dominate the Chinese market, while the USA has a more competitive environment with market share spread more evenly across firms. These differences highlight the dominance of key players in China compared to the USA's more diversified and mature market. Hence, new actors in China could face more important entry barriers.
C. The presence of new actors
The automotive industry, whether in China or the USA, is seeing the emergence of new players challenging existing manufacturers. In 2009, Alphabet (Google's parent company) founded the company Waymo in California. This company specializes in autonomous driving, aiming to establish itself as a key player in this rapidly growing sector. Similarly, the Chinese tech giant Baidu launched Apollo in 2017 to compete with Google's autonomous vehicle initiative.
Nevertheless, some key structural differences between the two companies deserve to be stressed. While most of Waymo's funds are coming from private investments (Alphabet, Chrysler, Qualcomm), Apollo benefits from considerable Chinese government investments. Additionally, Apollo takes advantage of numerous partnerships with Chinese automakers such as Geely, BYD, and Chery, whereas Waymo is not specifically collaborating with American automotive companies since they are mainly collaborating with Hyundai, a South Korean firm, and Jaguar Land Rover. The way that these two companies are funded and organized exemplify well the typical differences in Chinese and American industrial models that will be explored further in the following sections.
1.3 Consumer Preferences and Demand Differences
A. Differences in car ownership culture
General trends regarding automobile consumer behavior are still closely linked with culture and historical differences between China and USA. In the United States, this is characterized by a preference for large vehicles like SUVs and trucks, often used for personal freedom and long commutes. In China, cars are seen more as a status symbol, with a growing demand for EVs and compact vehicles suited for urban environments. It reflects dense Chinese cities and government incentives on EVs ownership.
B. Adoption of new technologies vehicles in Chinese and U.S. markets
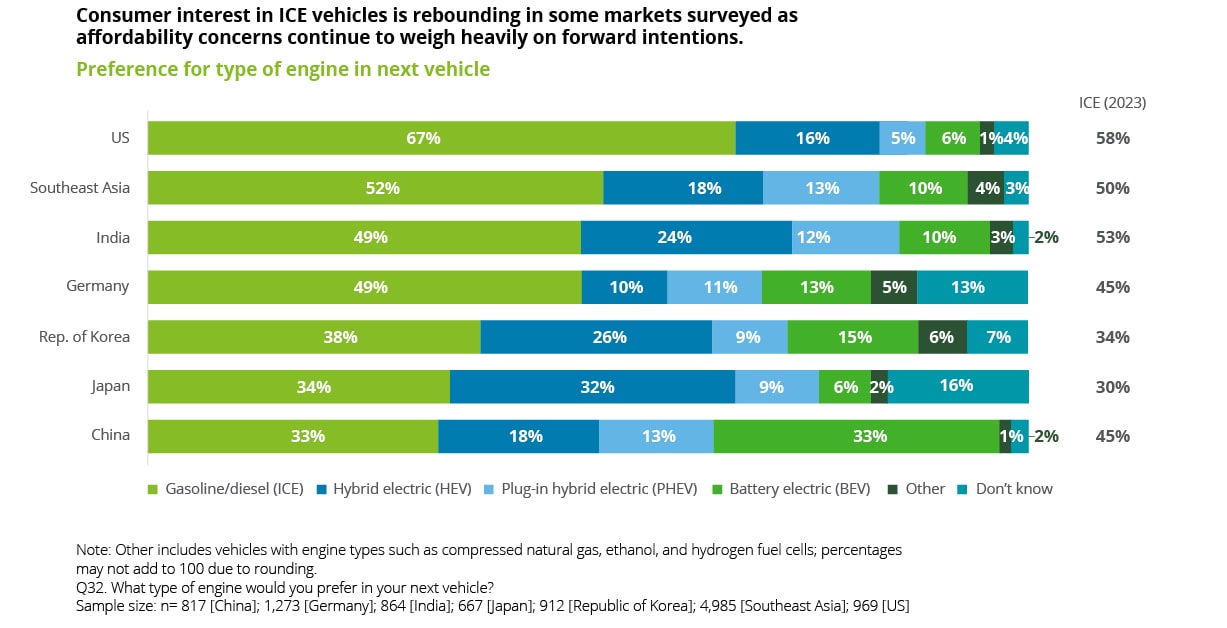
A survey held in the end of 2023 by Deloitte [6] demonstrates the greater importance of prices for American consumers than for Chinese ones to choose what car to buy (see figure 1.C). Indeed, Chinese consumers choices are mostly driven by the performance of the vehicle. Regarding the type of engine, only 27 per cent of Americans have a preference for a non-ICE vehicle, whereas 54 per cent of consumers in China have a preference for a vehicle that doesn't have an Internal Combustion Engine. Furthermore, Chinese consumers are considerably more willing to pay for more connectivity in a vehicle (60% "yes") than Americans (25% "yes"). These differences in new technologies acceptance stand as a key to understand consumer preferences and thus the likeliness for the autonomous vehicles market to develop in each country.
2. Innovation Management for Autonomous Vehicles in the U.S. and China
2.1 Technological Foundations of Autonomous Vehicles
A. Presentation of the technology of autonomous driving
Autonomous vehicles or self-driving vehicles are often classified based on 6 different levels (0 to 5) indicating how much a human has to be involved to drive the car. This definition has been defined by SAE International in 2014 [1]. In this part, the term Autonomous Vehicles (AVs) will refer to Level 4 or Level 5 vehicles. Level 4 vehicles can be driverless in defined use cases while Level 5 vehicles are constantly driverless which makes it possible to not have either pedals nor steering wheel. Self-driving technology is a competency enhancing innovation since its diffusion in the market would not make Level 0-1 vehicles obsolete. Additionally, this innovation is a component innovation which makes the incremental development of autonomous vehicles possible.
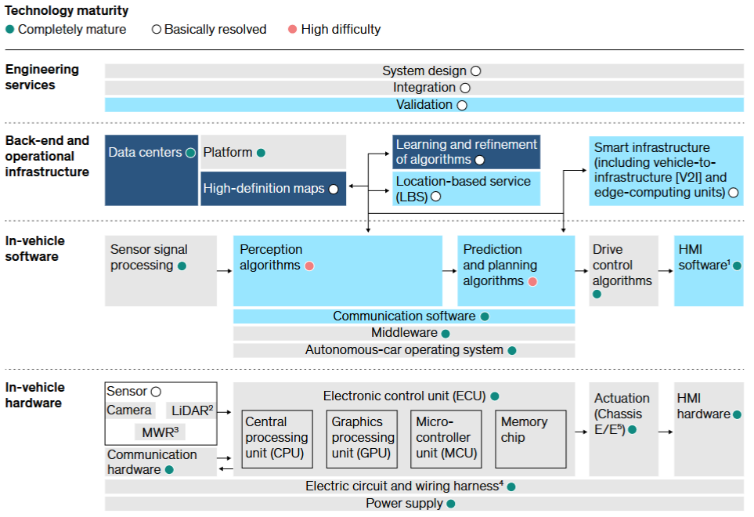
B. Sub-technologies enabling autonomous driving
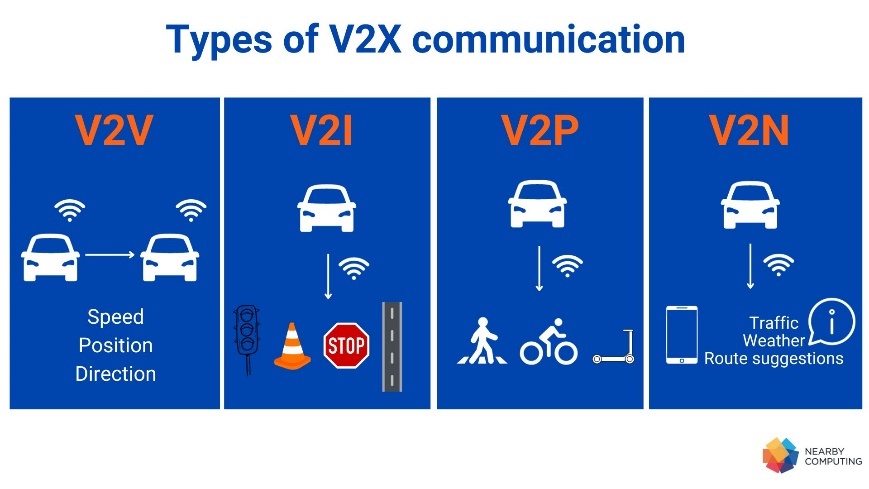
Autonomous driving (AD) is an innovation driven by a Science-push enabled by key sub-technologies' recent improvements. Compute power and driving data retrieval techniques have significantly improved recently which enabled the use of more precise Machine Learning models to provide efficient understanding of their environment to autonomous vehicles. Furthermore, sensor technologies improvements allow the system to take into account a larger environment detecting further items in a more precise way through the improvement of cameras, LIDARs (Light Detection and Ranging) and Radars. The development of faster communication protocols such as 5G technologies enables better Vehicle to Infrastructure or Vehicle to Everything communication (so called "V2X" communication) is also crucial to enable Level 4+ self-driving vehicles.
C. Diffusion stage
Even though ground-breaking progresses have been made in this field, Level 4 and 5 AV technology's development stage is still considered as emerging. Indeed, even though numerous pilot projects are taking place in specific limited areas to test AV, the diffusion of the technology is still at a beginning stage, barely adopted by early adopters but struggles to cross the Chasm to reach the early majority on the Roger's innovation diffusion pattern [2]. This is due to the lack of optimal software solution, of sufficient proof of usefulness provided by the early adopters to the potential early majority and to the lack of clear governmental regulations as explained in the third part of this essay.
D. Value appropriation of the firms
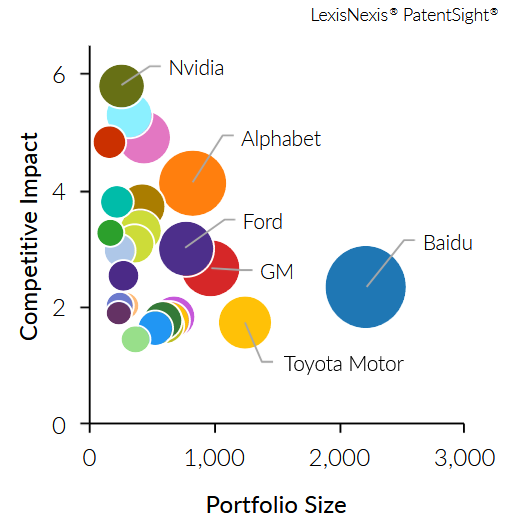
In the USA and in China, the main players have different elements of value appropriation from technologies. Indeed, some will emphasize on very Tacit and Complex knowledges which enhances their competitiveness thanks to less easily imitable and transferable technology knowledge. This is for example the case of Nvidia that focuses on Hardware and AI computing. Conversely, others such as the Chinese firm Baidu invest on more numerous and broader technological innovations (mainly in Vehicle to Everything "V2X" communication) in the field of Autonomous Driving, but with a lower competitive impact. Additionally, the figure shows the intermediate position adopted by Alphabet (Google's parent company), with a competitive impact between Nvidia and Baidu.
2.2 An Ecosystem for Innovation in Autonomous Vehicles
Developing and commercializing autonomous driving technologies requires a lot of complementary resources. Enormous data resources are needed to train the newest deep neural networks to understand the surrounding of the vehicle and make it behave as expected.
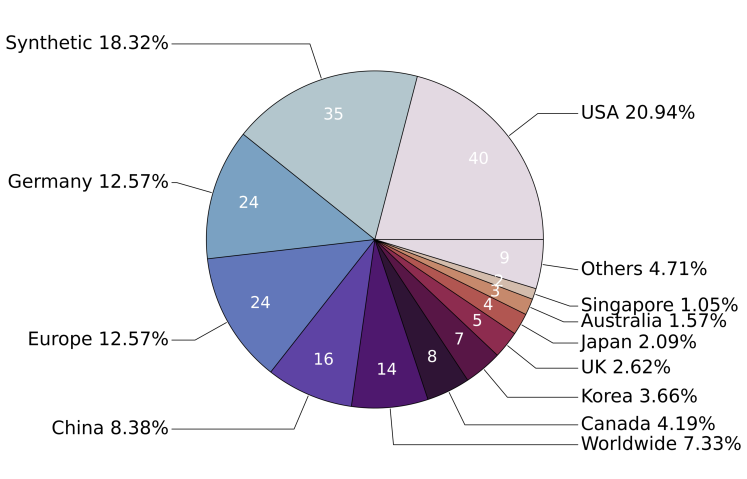
A. Data
According to the paper "A Survey on Autonomous Driving Datasets: Data Statistic, Annotation, and Outlook" (April 2024) [4], today, 20.9% of the annotated datasets in the world are owned by USA companies when Chinese own around 8% of them (figure 2.B). Since newest deep learning algorithms used in autonomous cars are more and more depending on data quantity, this is a clear advantage for the development of the AV in the US.
B. Infrastructure on the road
Infrastructure on the road is also primordial to reach Level 4+ self-driving vehicles. Indeed, such a vehicle needs an area where 5G is available in order to use V2X communication with other vehicles, signalization, and internet. Even though in 2020 the KPMG report "2020 Autonomous Vehicles Readiness Index" [6] placed China as the 16th most ready country for AV infrastructures while they ranked the USA on the 9th place, China's centralized effort made them able to recently progress faster than the USA on infrastructures thanks to their strong government creating less uncertainty than the American democracy regarding autonomous vehicles policies.
C. Talents
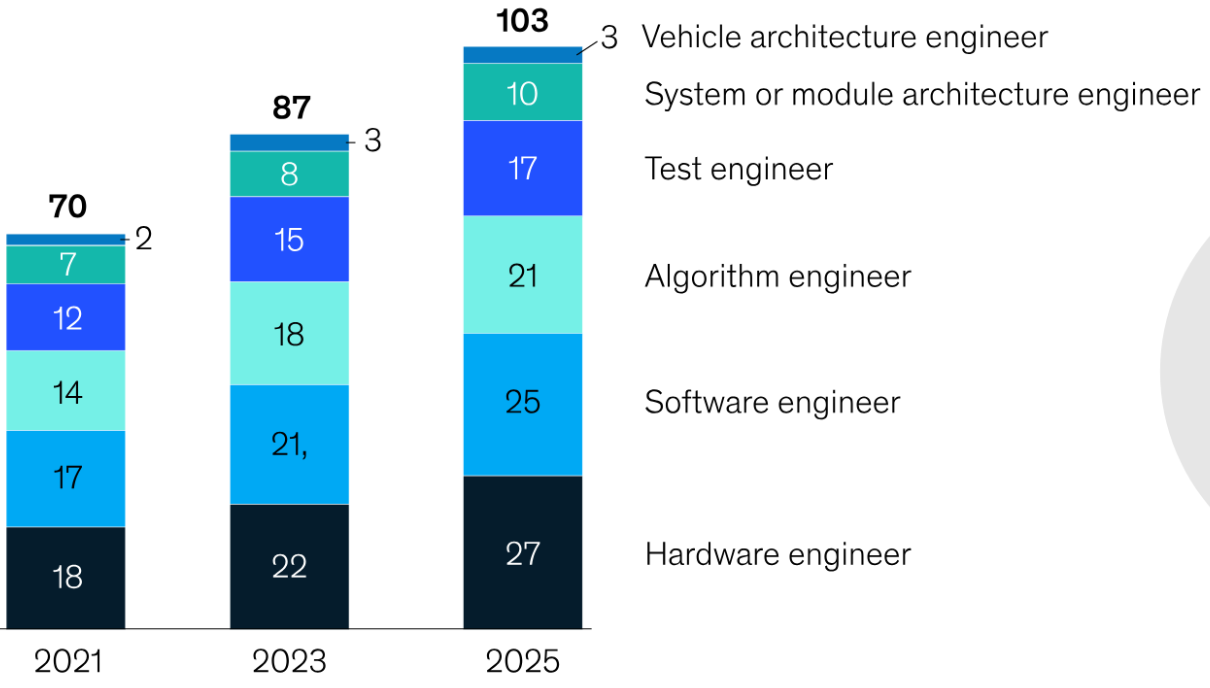
The technology and innovation environment for AV is strongly dependent on the Talents and working force available in each country. "From sci-fi to reality: Autonomous driving in China" report from McKinsey [7] underlines the increasing demand of talents by China from 2021 to 2025 in key technology domains for AVs.
D. Regulations and policies
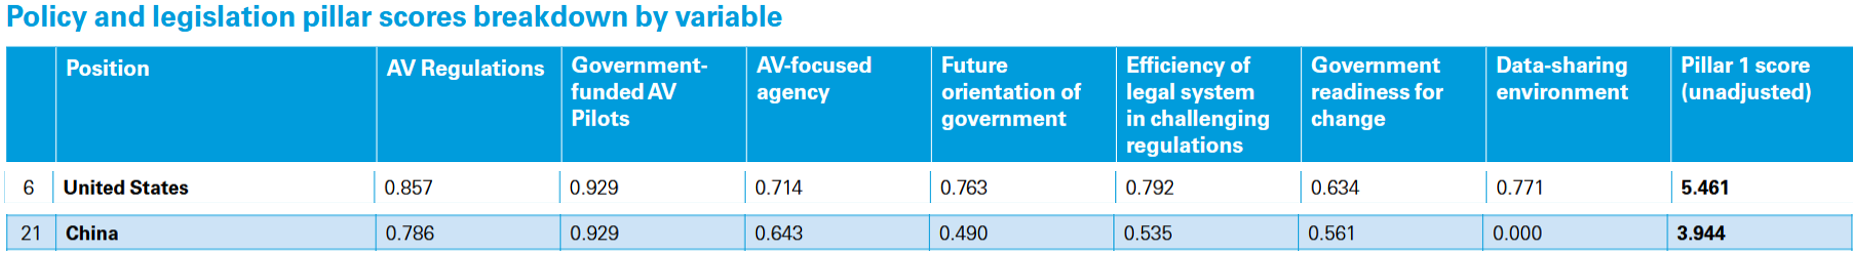
Although this concept cannot be defined as complementary resources since they are not in the hands of the firms, regulation and policies are major factors to allow an efficient development and adoption of the AV technology. The report from KPMG "2020 Autonomous Vehicles Readiness Index" [6] places the USA on the 6th position regarding policy and legislation, whereas China is ranked 21st. This is mainly due to their score of 0.00 on the "Data sharing environment" metric, when the US have a score of 0.771.
E. Conclusions regarding the technological ecosystem readiness
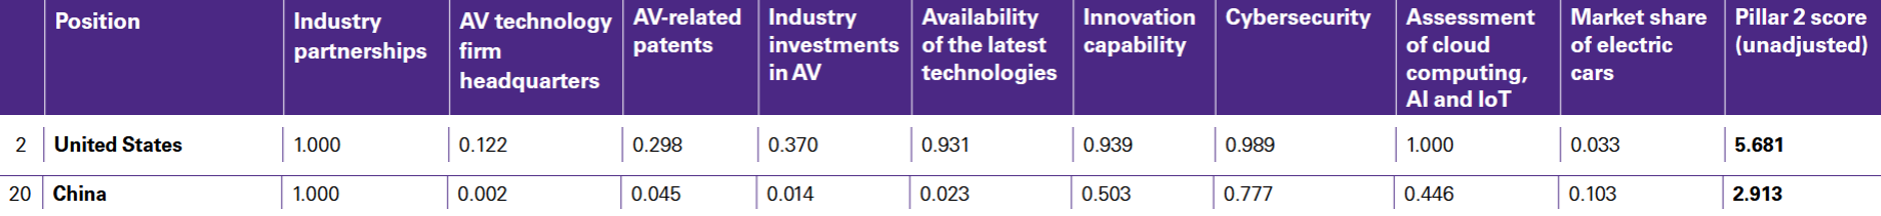
The same report from KPMG [6] ranks the United States as the 2nd most ready country regarding technologies and innovations for autonomous vehicles when China is only reaching the 20th place. The most significant differences are on their availability for the latest technology (USA scored 0.931 and China scored 0.023) and on their Assessment of cloud computing, AI and IoT (China scored 0.446 and the USA scored 1.0). However, China surpasses the USA on their market share of electric cars (0.103 vs 0.033).
2.3 Technology Adoption and Acceptance
Autonomous driving is representing a new discontinuity in the S-curve of vehicles. So far, the technologies performances and improvements are lower on these new technologies than on classic cars but its forecasts overcome it. Indeed, this period is witnessing turbulence and uncertainty about technology and business models.
A. Adoption influence factors
Main adoption influence factors for autonomous vehicles can be analyzed thanks to the Unified Theory of Acceptance and Use of Technology methodology (UTAUT) developed by Venkatesh in 2003. The scientific paper published in Nature "Using the Extended Unified Theory of Acceptance and Use of Technology to explore how to increase users' intention to take a robotaxi" [10] highlights that the willingness to adopt AVs is mainly driven by perceived personal benefits, societal impacts, and alignment with cultural or political values. However, significant barriers remain, such as regulatory constraints, trust issues with autonomous systems, and concerns about equitable access.
B. Consumers' readiness for Autonomous driving market penetration
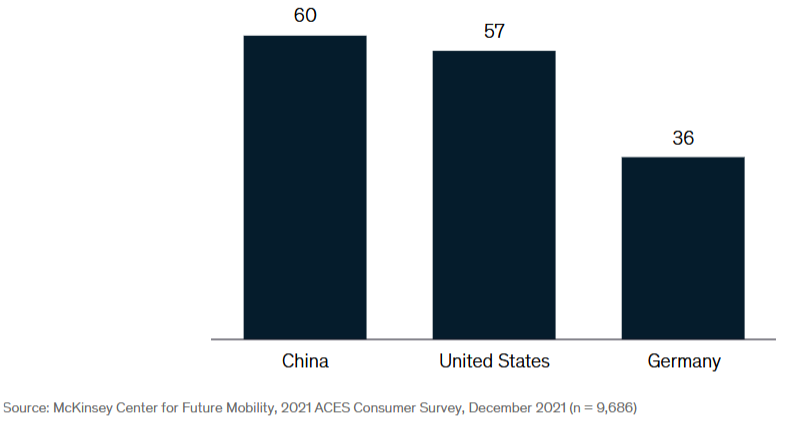
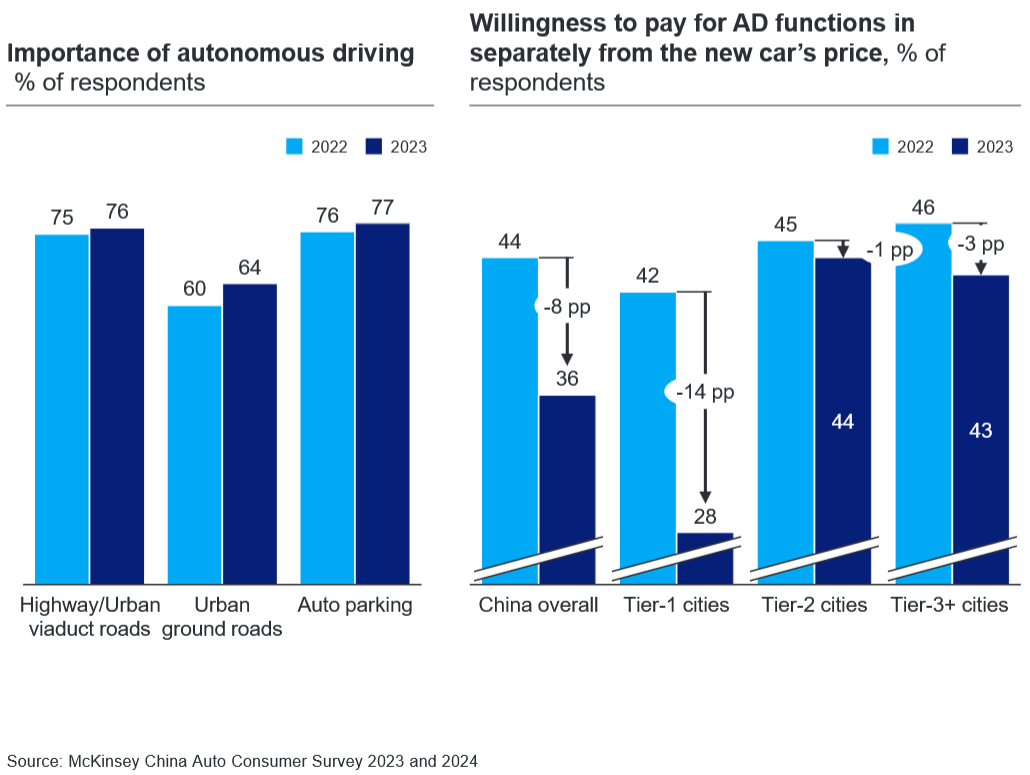
Overall, China's market keeps a better market penetration potential. As the December 2021 McKinsey Center for Future Mobility survey [8] shows, Chinese consumers are more likely than American consumers to embrace autonomous driving, more enthusiastic about autonomous functionalities, and more willing to pay — all of which has culminated in a high interest in purchasing L4 pilot vehicles.
This observation is counterbalanced by the 2024 McKinsey report showing a willingness to pay that has declined since 2021, even though interest in this technology remains similar. Nevertheless, it stays higher than the willingness of Americans to pay for this type of technologies.
3. Policies for the Autonomous Vehicles Industry in the U.S. and China
3.1 Geopolitical Dynamics and Tensions Between China and the U.S.
A. Dependence and Decoupling
The industrial competition between the USA and China can be analyzed through the concepts of decoupling and dependence. Decoupling is "the process of diverging into two technology ecosystems with an increasing degree of separation" [4]. Relying on the paper "Mapping U.S.–China decoupling and dependence" [4], the decoupling between China and the USA has been declining steadily since 2000 conforming to the effects of globalization. On the other hand, the paper shows an evolution of China's dependence drastically changing after the Great Recession of 2008 when China started to develop their own R&D and innovative capacity following a Delinking strategy.
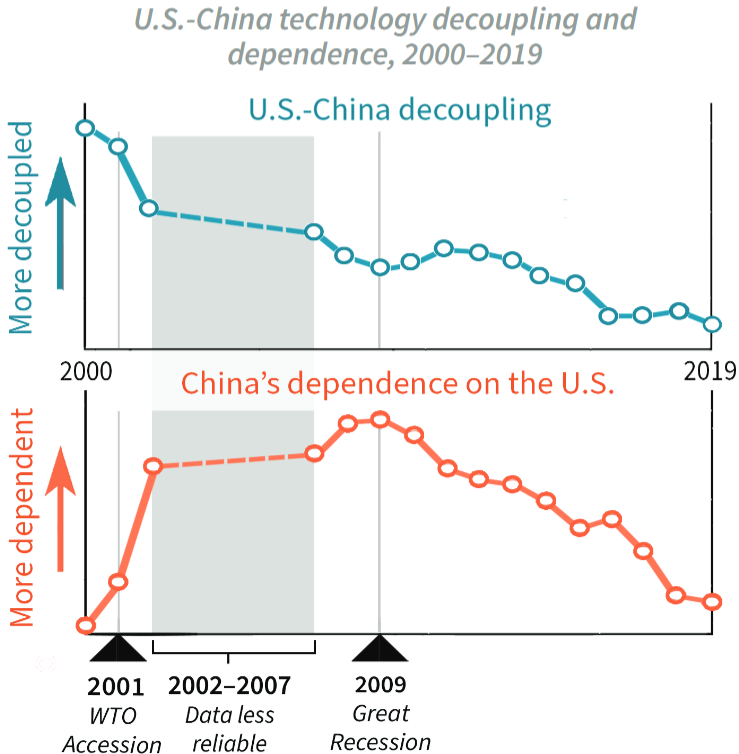
The paper also highlights that this delinking strategy is particularly effective in emerging high technologies. Autonomous vehicles represent one of the key areas China leverages to advance this delinking trend. However, constant tensions are suggested by the fact that greater decoupling in a field eventually leads to more dependence of China on the U.S. in this same field.
B. Industrial policies and their consequences
The U.S. has a very large array of tools to affect foreign industry and try to turn it to its advantage thanks to their powerful diplomacy and their leading position in numerous industries. However, China is now threatening their industrial competitiveness in the western world. The COVID-19 pandemic and the U.S.–China trade war highlighted the risks of overdependence on Chinese manufacturing for critical goods. This first led to calls for reshoring or diversifying supply chains. Nevertheless, fully decoupling from China has proven impractical due to its pivotal role in global supply chains. Consequently, the U.S. narrative has shifted to "de-risking," acknowledging that severing material flows from China is unfeasible while focusing on managing associated risks [6].
As political tensions are growing between China and the U.S., Washington's concerns about sensitive data that could be accessible by the Chinese government became a major incentive to protectionist restrictions. The Autonomous Vehicles industry is particularly touched by this type of policy.
Yet, overprotective measures led to unintended consequences on both sides. In China, Beijing's hyperfocus on technological self-reliance has meant overinvestment in high-priority sectors, generating oversupply. The article "How America's War on Chinese Tech Backfired" from Foreign Affairs [8] underlines that many Chinese economists are alarmed by the nationalistic direction of their country's economic policy. On the American side, restrictions on students pursuing technology degrees deprived the country of many talented students and possible innovative start-ups. Overall, too much security and nationalist policies lead to less innovation, less economic growth and fewer jobs. A more adapted model — "Slowbalization" — which involves combining domestic wise policies and international alliances, is suggested [8].
3.2 Governmental Regulation Landscape on AVs in China and the USA
A. Governance and policy framework differences
According to Norton Rose Fulbright's article "Autonomous vehicles: The legal landscape in the US" [1], in the U.S., state-level regulations for autonomous vehicles are limited, with only seven states and Washington, D.C., passing legislation related to AV testing, while 43 states have yet to regulate the technology. This leads to inconsistencies across states: each state has its own certification and approval processes, with testing hubs in states like Arizona and Nevada, while California enforces stricter regulations. However, federal oversight by the NHTSA is showing signs of flexibility by offering temporary interpretations of existing regulations.
In contrast, China's approach to AV regulations is more centralized. China's regulatory system is evolving through a pragmatic approach where central government sets the agenda, and local governments implement and optimize regulations based on pilot results. Shenzhen became the first city to allow self-driving cars on public roads in 2022, marking a significant step forward.
B. Intellectual Property policies
Secure IP rights have a different effect depending on the technological innovation development of the country of concern. A study [14] called "The link between intellectual property rights, innovation, and growth: A meta-analysis" shows that in developing countries, low protection rights on IP have good effects on innovation since it makes it simpler to imitate external innovations. However, as countries advance technologically and begin generating world-leading IP, securing this IP becomes more of a concern.
China's Intellectual Property evolved alongside their technological innovation progresses over time in such a way that it enables China to be the country where the most IP are filed according to the World Intellectual Property Indicators report of 2023 [10].
Conversely, a series of court decisions and pieces of legislation over the last two decades has weakened IP rights in the United States. The America Invents Act in 2011 created the Patent Trial and Appeal Board, which invalidates a high percentage of patents, creating uncertainty for innovators. Overall, these decisions resulted in more uncertainty reducing venture capital investments in patent-intensive industries.
3.3 Government Incentives to Strengthen AVs Development
A. Government subsidies to customers
In China, self-driving vehicles consumer adoption is supported through mainly subsidies on NEVs (New Energy Vehicles) purchases. As the Chinese Vice Minister of Finance Xu Hongcai said: "NEVs purchased in 2024 and 2025 will be exempted from purchase tax amounting to as much as 30,000 yuan per vehicle (≈ $4,098 USD)" [11]. In the USA as well, various subsidies are offered to encourage Electric Vehicles but not particularly vehicles with self-driving functionalities. Moreover, the rebates offered depend on the state: New York offers $2,000 under the Drive Clean Rebate program whereas California offers rebates of up to $7,500.
B. Government investments in R&D and AVs industry actors
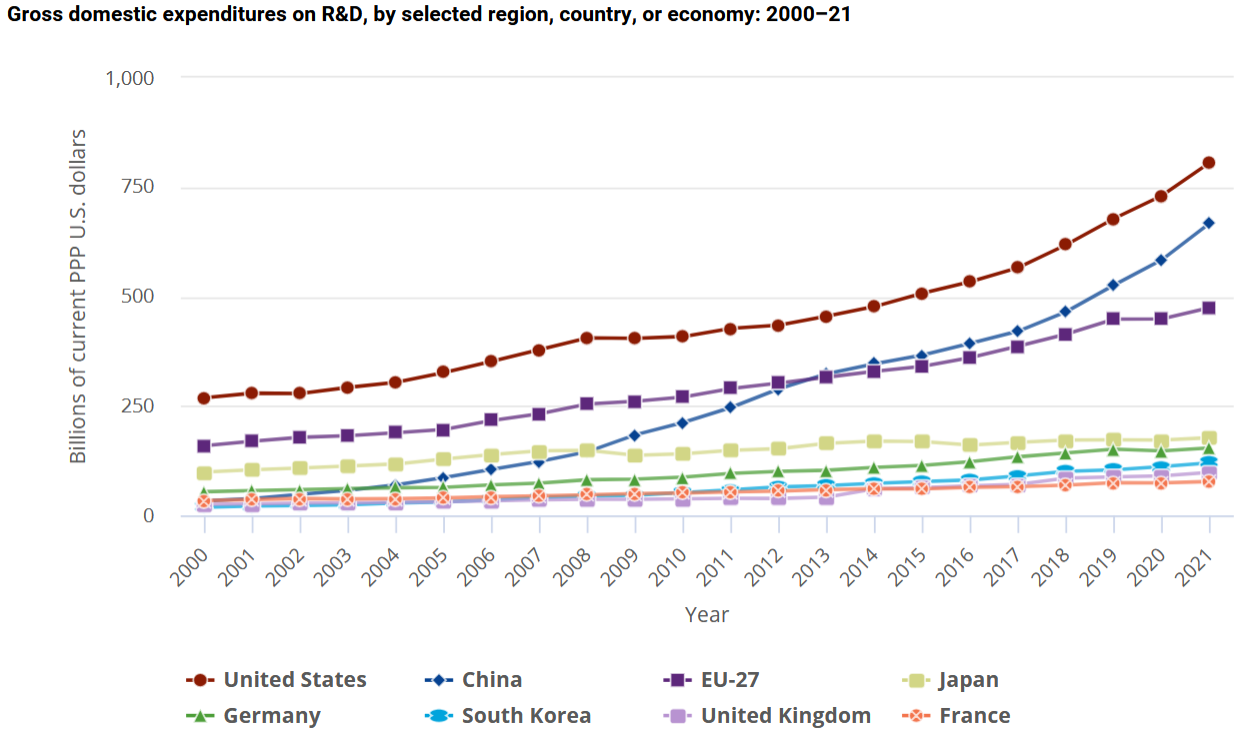
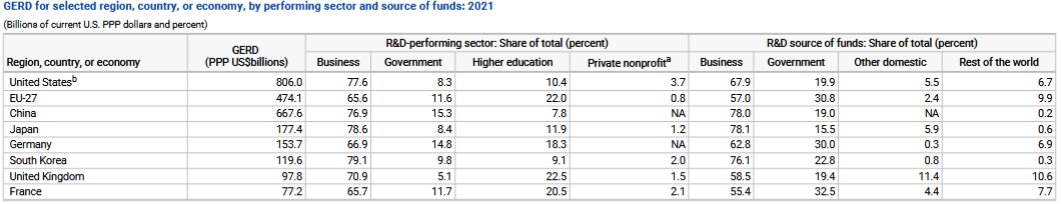
In addition to special funds directed to R&D on self-driving and AI technologies, the Chinese government offers direct subsidies and tax rebates to companies in key industries including self-driving vehicles. According to Gerald J. Krieger (PhD.) [12]: "China's advantage is that it can and will heavily fund these sectors, whereas the U.S. Government has outsourced much R&D to the private sector." However, the United States is still the largest performer of R&D, with $806 billion in gross domestic expenditures on R&D in 2021, followed by China, with $668 billion.
The following table (Figure 3.C) reveals a clear difference on the share of total R&D funds coming from the "Rest of the world" representing 6.7% in the U.S. but only 0.2% in China. Furthermore, the table demonstrates the higher importance of Governmental R&D in China (15.3% of performing R&D in the Government sector) than in the U.S. (8.3%). This is a major advantage for China, which can then better coordinate its research and innovation on a national level.
Bibliography
Part 1
- [1]: CEIC Data — USA Vehicle Registrations / China Vehicle Registrations
- [2]: ACEA — Economic and Market Report, Full year 2023
- [3]: CAR Group — Contribution of the Automotive Industry
- [4]: EqualOcean — China Automotive Industry Trends 2023
- [5]: CLB — Auto Workers and EV Transition in Chinese Market
- [6]: Deloitte — Global Automotive Consumer Study 2023
- [7]: goodcarbadcar.net
Part 2
- [1]: SAE — J3016 Levels of Driving Automation
- [2]: The Waves — AV Diffusion and Hype Cycle Pattern
- [3]: LexisNexis — Driving Toward Tomorrow
- [4]: A Survey on Autonomous Driving Datasets (2024)
- [5]: 5GAA — V2X Technical Report
- [6]: KPMG — 2020 Autonomous Vehicles Readiness Index
- [7]: McKinsey — From sci-fi to reality: Autonomous driving in China
- [8]: McKinsey — China Auto Consumer Insights 2024
- [9]: AlixPartners — ADAS Consumer Survey 2023
- [10]: Nature — Extended UTAUT for robotaxi adoption
- [11]: Object Referring in Videos with Language and Human Gaze
Part 3
- [1]: Norton Rose Fulbright — Autonomous vehicles: The legal landscape in the US
- [2]: IOT World Today — China Self-Driving Vehicles Safety Guidelines
- [3]: McKinsey — From sci-fi to reality
- [4]: Stanford — Mapping U.S.–China decoupling and dependence
- [6]: NBR — De-risking Global Supply Chains
- [7]: IOT World Today — US Eyes Ban on Chinese Software
- [8]: Foreign Affairs — How America's War on Chinese Tech Backfired
- [10]: WIPO — World Intellectual Property Indicators 2023
- [11]: Global Times — NEV tax exemptions
- [12]: NDU Press — From Made in China to Created in China
- [13]: NSF — Research and Development: U.S. Trends and International Comparisons
- [14]: ScienceDirect — IP Rights, Innovation, and Growth: A Meta-Analysis
- [15]: IIHS — Autonomous Vehicle Laws